Key Takeaways
- Win rate measures consistency, not just success: Tracking your win rate reveals the percentage of profitable trades, providing insight into the reliability of your strategy. However, it does not show the complete profitability picture.
- Expectancy reveals real trading edge: Calculating your average gains versus losses per trade highlights whether your strategy generates positive results over time, offering a truer measure of your trading edge.
- Risk-reward ratio guides disciplined position sizing: Consistently managing the ratio between potential profit and loss per trade helps you keep risk controlled and emotional decisions in check.
- Drawdown tracking sharpens resilience and recovery: Monitoring the deepest declines in your account balance teaches you to endure and bounce back from tough stretches, preparing you to avoid fatal trading mistakes and adapt your strategy.
- Average hold time exposes trade timing strengths and weaknesses: Analyzing how long you hold trades uncovers patterns in your timing, pointing to opportunities for improving entries and exits.
- Performance journaling unlocks actionable self-analysis: Maintaining a detailed trade journal ensures you identify recurring habits, emotional responses, and areas for refining your trading system.
- KPI synergy fuels disciplined growth: The greatest impact comes from reviewing all KPIs together. This holistic approach enables deeper performance analysis and supports robust, objective risk management practices.
Mastering these core trading KPIs empowers you to assess your process honestly, refine your edge, and consistently elevate both your discipline and resilience. With this strong foundation, let’s explore how each metric shapes enduring trading mastery.
Introduction
While most traders keep score by counting wins and losses, genuine mastery lives deeper. It’s about discovering the story your trading numbers tell. Disciplined tracking of trading KPIs transforms raw data into strategic insights. It reveals not only how often you win, but how well you manage risk, adapt to setbacks, and evolve your methods over time.
Focusing on the right performance metrics sharpens both your strategy and your self-awareness. By systematically monitoring win rate, expectancy, risk-reward ratio, and the honest details captured in your trading journal, you lay the groundwork for resilient growth and disciplined risk management. Together, these tools provide a true map for the journey. Now, let’s break down the seven essential KPIs every market warrior needs to master to turn results into lasting progress.
Understanding Core Trading Performance Metrics
Success in trading emerges from more than gut instincts or chance entries; it requires rigorous measurement and objective analysis of your performance. Each key performance indicator (KPI) acts as a vital signpost, highlighting both strengths and areas for growth as you work toward market mastery. Let’s examine each core metric in detail to see how they pave the way for consistent performance.
Stay Sharp. Stay Ahead.
Join our Telegram Channel for exclusive content, real insights,
engage with us and other members and get access to
insider updates, early news and top insights.
 Join the Channel
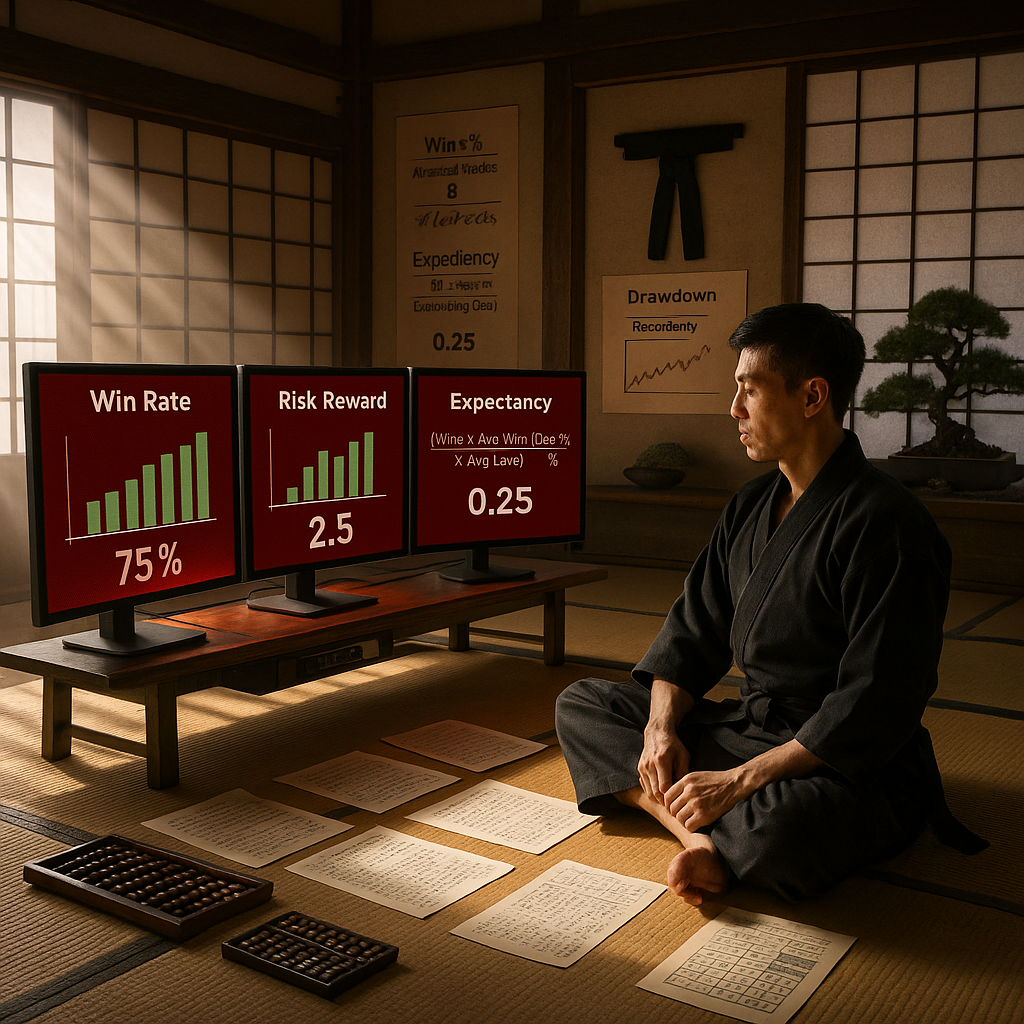
Win Rate
Your win rate is the percentage of profitable trades compared to total trades executed. While a high win rate sounds appealing, it’s only one aspect of your overall performance profile.
To calculate win rate:
Win Rate = (Number of Winning Trades ÷ Total Number of Trades) × 100
Key considerations for win rate analysis:
- A win rate between 40–60% can be highly profitable with strong risk management.
- Higher win rates may come with smaller average gains per trade, while lower win rates sometimes pair with larger winners.
- Focus on risk-adjusted wins rather than raw percentages.
- Track your win rate across market conditions, instrument types, and specific trade setups to spot where your strategy excels or struggles.
It’s crucial to remember that win rate alone isn’t a full measure of profitability. You have to interpret it alongside your risk-reward ratio and average trade size to truly judge the quality of your strategy.
Taking lessons from other industries, such as healthcare, where diagnostic accuracy (not unlike a trader’s win rate) must be weighed against the severity of cases handled, trading results get more meaningful when you set them in the context of other metrics.
Risk-Reward Ratio (R:R)
The risk-reward ratio captures how much potential profit you aim for each unit of risk you accept on a trade. This foundational metric underpins disciplined trading and long-term survival in the markets.
To calculate risk-reward ratio:
Risk-Reward Ratio = Potential Profit ÷ Potential Loss
Essential R:R practices:
- Aim for a minimum R:R of 1:1.5 for most setups. Some higher-probability strategies might justify a slightly lower R:R, as long as losses stay small and consistent.
- Carefully document planned versus actual R:R for each trade, making some notes on why differences happened.
- Adjust your position sizing based on R:R opportunities, so that no single loss can seriously hurt your capital base.
This concept is just about everywhere. In finance, portfolio managers are always weighing return potential against risk exposure. In retail, pricing strategies get balanced with the risk of excess inventory. Consistency in applying risk-reward principles supports sustainable performance in any field.
Average Trade Return
Average trade return shows the typical profit or loss you experience per trade. This gives you critical guidance for position sizing, capital allocation, and future expectations.
Calculate average trade return:
Average Trade Return = (Total Profit and Loss of All Trades) ÷ (Total Number of Trades)
Key components to track:
- Average profit from winning trades
- Average loss from losing trades
- The largest single win and the largest loss
- How profits and losses are distributed (frequency and clustering)
Getting familiar with this metric gives you a realistic baseline for your system’s behavior. That helps you set more appropriate stop-loss margins and profit targets. In marketing, for example, average customer lifetime value works much like average trade return, guiding budget allocation and performance measurement.
Maximum Drawdown
Maximum drawdown is the largest percentage drop from a peak to a trough in your trading balance, putting a spotlight on your strategy’s capacity to handle tough periods. This metric is fundamental for setting risk boundaries and mental expectations.
Stay Sharp. Stay Ahead.
Join our Telegram Channel for exclusive content, real insights,
engage with us and other members and get access to
insider updates, early news and top insights.
Join the Channel
To calculate maximum drawdown:
Maximum Drawdown = ((Peak Value - Trough Value) ÷ Peak Value) × 100
Critical drawdown considerations:
- Compare drawdowns over different periods to spot patterns or weaknesses.
- Set a maximum acceptable drawdown that fits your nerves and financial comfort.
- Document how long it takes to recover from major drawdowns, and assess your recovery plans.
- Study steep slides for patterns or errors that need correcting.
Drawdown management isn’t unique to trading. Environmental science tracks resources this way to inform conservation. In big business projects, keeping an eye on cash flow drawdowns helps prevent insolvency. The end goal is the same: resilience through proactive management.
Sharpe Ratio
The Sharpe ratio measures your returns in relation to the amount of risk (volatility) you take to earn them. It’s a more nuanced metric than raw returns, showing if your profits truly justify the risks involved.
To calculate Sharpe ratio:
Sharpe Ratio = (Average Return - Risk-Free Rate) ÷ Standard Deviation of Returns
Key Sharpe ratio insights:
- A higher Sharpe ratio signals stronger risk-adjusted performance; that is, you’re using your risk capital more efficiently.
- Use Sharpe ratios to compare the effectiveness of different strategies or asset classes.
- Lean on this metric to shape position sizing or tweak leverage when it’s appropriate.
- Track your Sharpe ratio over time for early warnings of weaknesses or shifting market risks.
It’s a staple in finance, but the idea appears elsewhere too—think healthcare (measuring treatment effectiveness per risk), or logistics (weighing efficiency against volatility in service).
Profit Factor
Profit factor tells you how your gross profits stack up against your gross losses, making it a no-nonsense indicator of your trading system’s efficiency.
To calculate profit factor:
Profit Factor = Gross Profit ÷ Gross Loss
Important profit factor guidelines:
- Shoot for a profit factor above 1.5 as a baseline for healthy systems.
- Break it down by trade setup, timeframe, or market context to pinpoint what works.
- Regularly monitor changes to spot trend shifts or inefficiencies early.
- Compare strategies using this metric, especially during backtesting and performance reviews.
Beyond trading, you see this logic in operations management. Controlling cost overruns is just as essential as boosting revenue.
Expectancy
Expectancy blends your win rate and risk-reward ratio to reveal your system’s average expected return per unit of risk. It’s a practical, big-picture metric that can directly predict long-term profitability.
To calculate expectancy:
Expectancy = (Win Rate × Average Win) - ((1 - Win Rate) × Average Loss)
Critical expectancy considerations:
- A positive expectancy is the bedrock of sustainable trading.
- Track expectancy results across different strategies and as markets evolve to check robustness.
- Use expectancy to adjust your position-sizing formulas and make the most of your capital.
- Expectancy is just as important in insurance, where it drives premiums and profitability.
By combining several KPIs, expectancy offers actionable insight for traders and many other fields. It’s an invitation to judge your performance by more than just outcomes.
Conclusion
Mastering the core performance metrics of trading (including win rate, risk-reward ratio, average trade return, maximum drawdown, Sharpe ratio, profit factor, and expectancy) gives you a disciplined and honest framework for reviewing your progress. These aren’t just numbers; they’re vital tools for any aspiring market warrior, letting you spot both your strengths and your blind spots.
Regular, objective measurement and interpretation of these KPIs moves you past guesswork. You start building real competence, clarity, and self-mastery, which are all critical for sustainable success. This kind of honest self-analysis helps you adapt your strategies, encourages personal growth, and gives you a serious defense against emotional decisions.
Just like in martial arts, where progress depends on regular self-assessment and endless practice, trading mastery is rooted in accountability and the drive to keep improving. Treating every trade, win or loss, as part of your learning journey can sharpen your edge for whatever comes next.
Looking ahead, the traders who rise to the top will be those who consistently improve their metrics, challenge their own biases, and keep discipline at the center of their game. The future goes to those who anticipate change, adapt quickly, and use their analytics with both integrity and clarity. Now ask yourself: Will you approach your trading path with the dedication of a true market warrior—measuring, refining, and mastering every step along the way?
Strategy. Discipline. Mastery. | The Way of the Market Warrior

Leave a Reply