Key Takeaways
- The NQH2O Water Price Index has become a foundational benchmark for introducing transparency and financial discipline to California’s spot water market.
- Grasping how the NQH2O index is calculated, its role within the broader water market, and the mechanics of futures settlement is essential for anyone committed to effective water risk management or financial hedging in this unique commodity sector.
- By aggregating transaction data across California’s key water markets, the NQH2O index standardizes spot water prices. This approach ensures transparent, timely price discovery for all market participants.
- The index employs rigorous calculation methods, systematically excluding outliers and non-arm’s length deals, and focusing only on recent, representative trades. This supports greater accuracy and fairness in water pricing.
- CME water futures (NQH2O contracts) settle on the monthly average of the index, enabling buyers and sellers to hedge water price exposure efficiently with cash-settled arrangements, eliminating the need for physical water delivery.
- Movements in the NQH2O index reveal shifts in supply and demand, drought impacts, regulatory changes, and evolving agricultural water needs. This makes it an essential tool for understanding and responding to California’s complex water risks.
- The NQH2O product revolutionizes water risk management for farmers, municipalities, and investors, bringing the strategic discipline of traditional commodity markets to the increasingly vital realm of water.
Introduction
California’s spot water market is much more than a simple exchange of resources. It is a living, breathing reflection of environmental volatility, agricultural imperatives, and evolving regulations. The NQH2O Water Price Index introduces precision to this unpredictability, granting market clarity and discipline akin to benchmarks long established in oil, grain, or metals.
By consolidating verified trade data and filtering out market noise, the NQH2O index transforms fragmented deals into a single, actionable standard. For anyone navigating California’s water landscape (or seeking to shield their operations from price uncertainty) understanding how this index operates, correlates with real-world risks, and shapes futures settlement is not only wise, it is imperative.
Mastery of the NQH2O index demands a commitment to transparency, data integrity, and disciplined financial strategy. Exploring its mechanisms provides a clearer path through the complexities of water risk management, offering a model for a new era of informed resource stewardship.
Let’s explore how the NQH2O index serves as the backbone of professional water price discovery: unpacking its calculation, real-world connections, and pivotal role in setting a new market standard.
Stay Sharp. Stay Ahead.
Join our Telegram Channel for exclusive content, real insights,
engage with us and other members and get access to
insider updates, early news and top insights.
 Join the Channel
Understanding the NQH2O Water Price Index
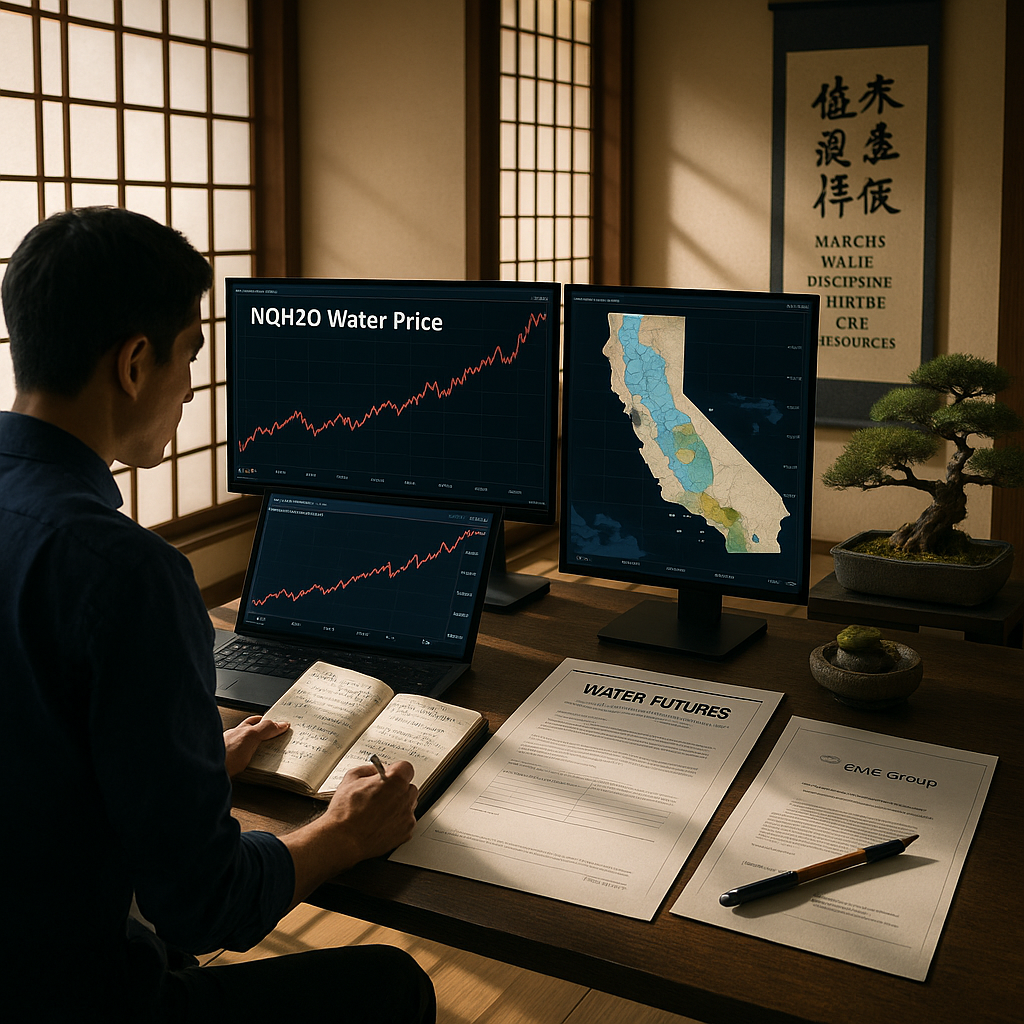
The Nasdaq Veles California Water Index (NQH2O) marks a major leap forward in commodity finance through its targeted focus on California’s five largest and most actively traded water markets: Central Basin, Chino Basin, Main San Gabriel Basin, Mojave Basin, and Santa Ana Basin. Each week, the NQH2O reports the aggregated spot price of water rights in these regions, expressed in U.S. dollars per acre-foot ($/AF), a precise unit reflecting the volume of water most relevant to agricultural and municipal users.
The need for the index arose from a fundamental market inefficiency. Despite its critical importance, water’s price has often been clouded by opacity and fragmentation. With the NQH2O index, aggregation and standardization of transaction data finally provide a reference price rooted in tangible, arm’s length market activity rather than speculation or imprecise surveys.
This leap in transparency has far-reaching effects across California’s $50+ billion agricultural sector, supporting a population of nearly 40 million. In a state where persistent water scarcity is amplified by climate shifts, unprecedented visibility into spot water pricing empowers proactive response and better long-term planning. For instance, the 2021 drought drove the index to record highs above $1,100 per acre-foot. It was an accurate reflection of emergent scarcity premiums and a warning signal to all market participants.
The index achieves its impact through three main mechanisms:
- Standardization: It translates diverse markets and transaction types into a single, comparable price metric, allowing apples-to-apples comparison across regions and seasons.
- Public Price Discovery: The NQH2O offers a publicly accessible price benchmark, dismantling the opacity that once limited rational decision-making.
- Consistent Methodology: The index’s rules-based construction provides continuity over time, enabling market participants to analyze seasonal and historical pricing trends with confidence.
These advancements benefit a diverse array of stakeholders, including:
- Agricultural Producers: By referencing the index, farmers can assess the real opportunity cost of water, implement data-driven irrigation strategies, and time their purchases to manage input expenses.
- Municipalities and Utilities: City water managers and districts use the index to budget more accurately, allocate resources, and justify procurement policies to ratepayers and regulators.
- Investors and Financial Institutions: Asset managers, hedge funds, and insurers now have a robust tool for evaluating water risk and developing financial instruments tailored to water scarcity and price volatility.
- Policymakers: Regulators can benchmark allocations, draft responsive policy, and better quantify the economic impacts of legal and regulatory interventions.
By replacing fragmented pricing with transparent, standardized data, the NQH2O index increases liquidity and efficiency. It encourages responsible resource allocation, ensures market participants have equal information, and underpins the stability required for California’s economy to thrive in the face of perpetual water scarcity.
How the NQH2O Index is Calculated
Creating a robust, credible benchmark begins with gathering authoritative data. The NQH2O index relies primarily on WestWater Research’s proprietary database, which collects granular details of real-world water trades throughout California. This proprietary information is cross-validated by public sources such as county recorders, the California Department of Water Resources, and state water boards, ensuring legal and factual accuracy for every included transaction.
The calculation of the index follows a systematic, disciplined methodology:
-
Data Aggregation: All water rights transactions within the five target basins are collected and reviewed, focusing on trade details like type of water right, lease duration, location, and volume.
-
Transaction Selection: The index excludes permanent transfers to focus on short-term (one year or less) leases, which best represent current market dynamics and minimize the distorting effects of long-term, strategic investments.
-
Weighting Methodology: Each transaction’s impact on the index is proportional to its volume in acre-feet. This ensures that larger, commercially significant trades shape the price more than fringe or one-off deals.
-
Calculation Formula:
NQH2O Index Value = ∑(Transaction Price × Transaction Volume) ÷ ∑(Transaction Volume)
Quality control is an integral part of the process:
- Verifying Authenticity: Each trade is cross-checked against public records to confirm it is a true, voluntary, arm’s length transaction, not an administrative reallocation within organizations.
- Filtering Outliers: Statistical screening identifies and removes transactions with prices far outside the prevailing market range, protecting the index from manipulation or data artifacts.
- Normalizing Terms: Adjustments are made for location, timing, and water quality differences, so varied deals are truly comparable.
- Independent Oversight: A governance committee regularly reviews the methodology, ensuring transparent and objective application of all rules.
To be included, a transaction must meet strict technical criteria:
- The trade must involve unaffiliated parties (not related entities).
- Price per acre-foot must be clearly documented.
- The deal must pertain to the five designated basins.
- Only short-term lease transactions (maximum one year) are considered.
- The water must be suitable for either municipal or agricultural use, not subject to severe quality constraints.
- The minimum transaction volume is 10 acre-feet to maintain statistical relevance.
The index is published weekly, typically every Wednesday after market close. This balance between timeliness and market activity makes the NQH2O a stable, actionable reference. A monthly average is also calculated, serving as the settlement value for water futures and further supporting market consistency.
Correlation: Linking the Index to Real-World Water Risks
A truly effective benchmark reflects the underlying realities of its market. The NQH2O index demonstrates strong correlation with the primary drivers of water price volatility: drought, regulation, and seasonal demand.
- Drought Conditions: Historically, the index rises sharply during droughts. From 2012 to 2016, as California endured exceptional dryness, the index doubled—from roughly $450 to $1,000 per acre-foot, accurately tracking water scarcity premiums. In the 2021 drought, a 56% index surge over six months mirrored shrinking reservoir levels and increased competition for limited supplies.
- Regulatory Shifts: Water policy can rapidly reshape market dynamics. The passage of the Sustainable Groundwater Management Act (SGMA) in 2014 prompted a swift 15% increase in the index as water users scrambled for compliant supplies. Similarly, the 2022 zero-allocation announcement from the State Water Project triggered a 12% month-over-month index jump, highlighting regulatory influence on pricing.
- Agricultural/Seasonal Demand: Agricultural cycles play a major role, with a 0.73 correlation between farming water demand and index values. In the April-June planting window, prices routinely command a 10-18% premium over winter lows, even in years with ordinary rainfall.
Detailed case analysis proves the point. For example, as Central Valley Project reservoir levels dipped below 35% in June 2021, the NQH2O index climbed 17% in one month. When the federal government declared the first-ever Colorado River shortage in August 2021, prices spiked to $936. This reflected not just scarcity but heightened risk awareness.
By analyzing the index alongside factors such as Sierra snowpack or regulatory edicts, stakeholders can build predictive models. For instance, every 10% drop in snowpack translates to a 7-9% rise in water price three months later. These insights enable agricultural producers, cities, and even insurers to anticipate price swings and proactively manage risk, not just respond after the fact.
These correlation patterns align the NQH2O with similar market-informed benchmarks in other industries. In energy, natural gas spot indexes respond closely to weather events and regulatory changes. In agriculture, commodity indexes mirror harvest yields and export policies. Increasingly, sectors such as finance, insurance, and environmental management are leveraging these real-time indicators to protect assets, refine forecasts, and inform investment strategy.
NQH2O Index and Water Futures Settlement
The practical next step in financializing water is the development of futures contracts linked directly to the NQH2O index. The CME Group’s California Water Futures, standardized at 10 acre-feet per contract, deliver just that. This product enables market participants to lock in exposure or hedge against water price movements well into the future, introducing powerful risk management capability without the need for physical water delivery.
Stay Sharp. Stay Ahead.
Join our Telegram Channel for exclusive content, real insights,
engage with us and other members and get access to
insider updates, early news and top insights.
Join the Channel
The settlement design of these contracts further demonstrates financial discipline:
- Cash Settlement, Not Physical: Settlement is based exclusively on the monthly arithmetic average of the NQH2O index, rather than any attempt to deliver actual water. This approach sidesteps the logistical, legal, and infrastructure complexities inherent to physical water transfers. The challenges would be insurmountable at scale.
- Smoothing Volatility: By using the monthly average rather than a single weekly print, contracts minimize settlement risk stemming from one-off price spikes or seasonal irregularities. This creates a more robust benchmark, supporting both speculative and hedging positions.
- Broader Applicability: Cash-settled futures, anchored to a transparent and objective index, appeal to a wide array of participants, from farmers and utilities looking to cap input costs to institutional investors seeking uncorrelated exposure or environmental hedges.
Other industries have successfully adopted similar products. In energy markets, cash-settled electricity or gas futures provide flexibility to producers and utilities. In finance, weather derivatives settle against index benchmarks to protect agricultural and insurance business lines from unexpected losses. As water markets mature, the adoption of transparent pricing and cash-settled futures is setting new standards in risk management for resource-constrained sectors worldwide.
Expanding the Impact: Cross-Industrial Relevance
The emergence of the NQH2O index has catalyzed similar data-driven, transparent benchmarking in other industries where risk is tied to scarce or volatile resources. For example:
- Healthcare: Water scarcity impacts hospital operations and pharmaceutical manufacturing, leading organizations in the sector to monitor the index for supply chain risk management and emergency preparedness planning.
- Finance and Insurance: Global insurers use the index to underwrite policies against drought risk or business interruption for California-based enterprises, while asset managers assess water exposure for mortgage-backed securities and agri-loan portfolios.
- Education and Research: Universities and think tanks use NQH2O data to model environmental stress on urban planning or to guide curriculum for future water resource managers.
- Legal and Regulatory Compliance: Law firms and compliance officers reference the index when drafting contracts for water-intensive projects or when negotiating regulatory settlements.
- Consumer Goods and Retail: Beverage companies and food processors rely on index trends to coordinate purchasing strategies and mitigate production risk associated with water price volatility.
- Environmental Science: Resource allocation models and climate adaptation plans depend on accurate, timely price signals like those provided by NQH2O to optimize usage and minimize ecological disruption.
By offering a model for transparency, discipline, and financial integration, the NQH2O index demonstrates a replicable framework applicable to other regions and industries grappling with resource scarcity.
Conclusion
The NQH2O Water Price Index marks a transformational step in harmonizing California’s complex water market with the rigor and transparency expected of modern global commodities. Through disciplined data aggregation, objective calculation, and robust correlation with real-world risks, the index equips stakeholders across agriculture, government, finance, and beyond with a unified standard for pricing, hedging, and planning.
Its seamless integration with cash-settled water futures heralds a new chapter. Not only for California but for global resource markets seeking innovation in risk management and sustainability. As water volatility intensifies under the combined pressures of climate change, regulation, and economic demand, tools like the NQH2O provide the foundation for smarter, more resilient strategies.
Looking ahead, the true advantage will belong to those who embrace such disciplined analytics. Not just to react, but to anticipate, strategize, and thrive in a future where transparency is the foundation of mastery. Whether you are a policy architect, market participant, or forward-thinking investor, now is the time to harness the power of data-driven water risk management and set a new standard for responsible stewardship in an era when every drop counts. Strategy. Discipline. Mastery. The way of the market warrior.


Leave a Reply