Key Takeaways
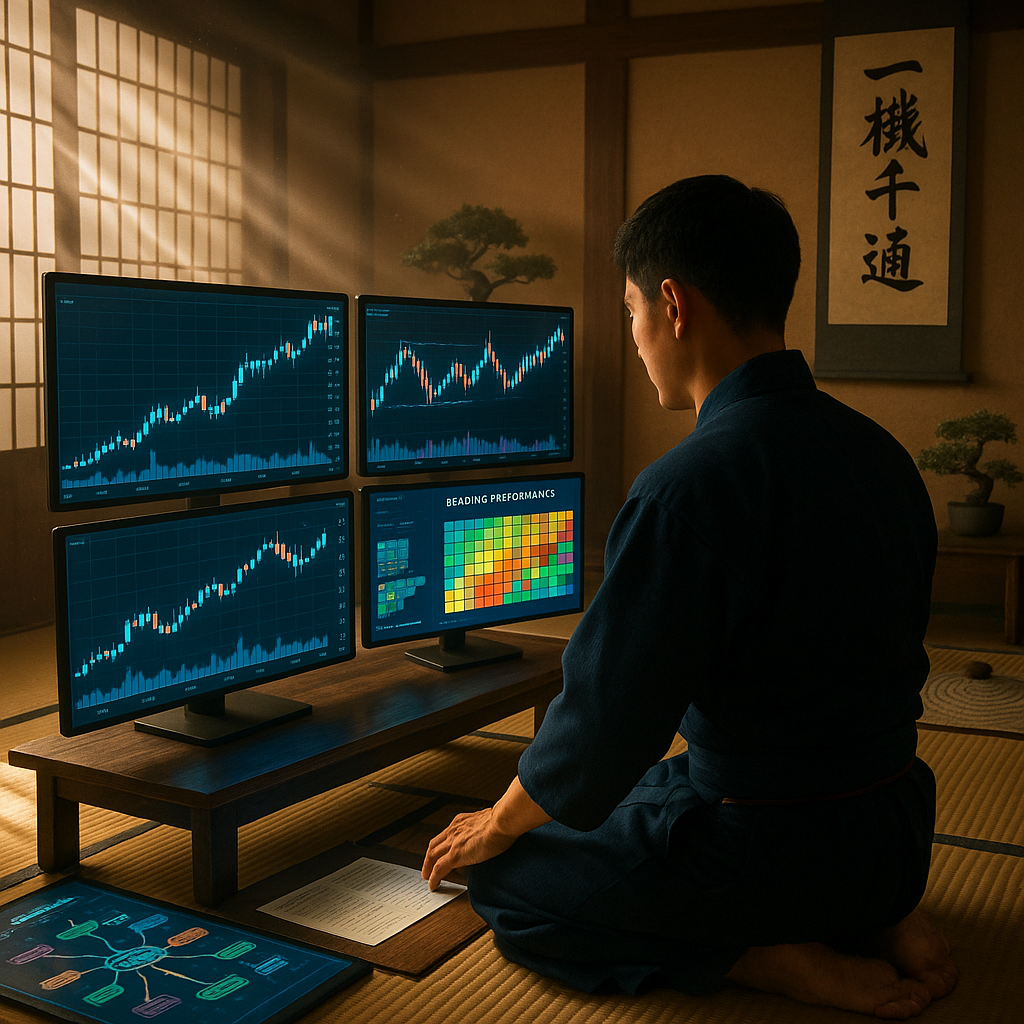
- See the path clearly with visual planning. Leveraging visual tools such as annotated charts, mind maps, and trade journals transforms overwhelming data into actionable insights. These approaches enable traders to plan and review with greater clarity, cultivating strategic discipline in their trading routines.
- AI shines a spotlight on trading habits. By integrating AI-powered analytics, traders uncover subconscious behavior patterns, repeated mistakes, and emotional triggers. This heightened self-awareness becomes a strategic advantage, guiding continuous improvement.
- Master the market through disciplined visualization. Consistent use of visual planning tools builds structured habits and supports the creation of routines. This discipline helps traders adhere to their strategies, resist impulsive actions, and maintain composure in the face of volatility.
- Turn complexity into confidence with AI insights. AI systems simplify chaotic market data by surfacing key patterns and suggesting optimal actions. This allows traders to focus on the quality of their decisions, rather than wrestling with information overload.
- Continuous growth through behavior feedback loops. Regularly visualizing and reviewing performance empowers traders to diagnose strengths and weaknesses. This habit fosters self-mastery and supports a mindset of lifelong learning.
Harnessing visual planning and AI not only brings clarity to your trading process. It accelerates your journey toward disciplined mastery. In the following sections, we will explore the essential methods, tools, and mindsets designed to elevate your trading practice to new heights.
Introduction
In today’s markets, many traders face an overwhelming flood of data, yet often fail to notice the patterns shaping their own decisions. Visual planning reverses this dynamic. By transforming raw charts and complex numbers into strategic maps, it enables clear, disciplined action and a structured approach to both the markets and your own behavior.
The integration of AI further enhances these visual tools, giving traders an additional lens for analysis. AI not only strengthens technical approaches, but also uncovers hidden habits, emotional triggers, and fresh opportunities for growth. When you combine visual planning with AI-driven insights, you create routines that nurture composure under stress, reinforce risk management, and pave the way for genuine self-mastery in unpredictable markets.
In this article, we will delve into how disciplined visualization and intelligent AI guidance can upgrade your trading process, making each decision a purposeful stride toward long-term expertise rather than a reckless leap into the unknown.
Stay Sharp. Stay Ahead.
Join our Telegram Channel for exclusive content, real insights,
engage with us and other members and get access to
insider updates, early news and top insights.
 Join the Channel
The Foundations of Visual Planning in Trading
Building a solid trading practice starts with transforming abstract concepts into tangible, actionable visuals. Visual planning provides clear frameworks that make the decision-making process more effective and support disciplined execution. Through the right visualization techniques, traders can better process evolving market information, stay focused, and track their progress over time with greater clarity.
discipline rituals
are central to this process, instilling the habits and routines that support effective visual planning and sustained trading success.
Core Components of Visual Trading Plans
Every effective visual planning system in trading is rooted in three essential components: strategy mapping, execution frameworks, and performance tracking. Understanding the role of each can dramatically strengthen a trader’s discipline and decision-making.
A comprehensive strategy map typically includes:
- Clear entry and exit criteria portrayed with flowcharts
- Risk management guidelines outlined in decision trees
- Market condition assessments structured in visual hierarchies
- Time-frame correlations displayed through layered diagrams
These visual frameworks enable traders to navigate high-pressure scenarios with more consistency. Organizing key trading elements in visual formats also reduces cognitive load, allowing for faster and more accurate decisions.
Modern Tools for Trading Visualization
Progress in technology has equipped traders with advanced solutions for visual planning. These innovations offer deeper insight, automation, and adaptability; all essential for today’s complex market dynamics.
AI-Enhanced Charting and Analysis
Artificial intelligence is revolutionizing the way traders visualize and analyze market data. With the latest AI-powered tools, traders can:
- Automatically highlight complex price patterns and chart formations
- Generate dynamic market views across multiple dimensions
- Receive real-time visual alerts customized to their individual trading style
- Automate the creation of detailed visual trading journals for systematic review
By blending AI analytics with traditional charting techniques, traders gain an enhanced perspective. This approach combines the speed and power of automation with the critical thinking and strategic oversight that only humans can provide. The result is an optimal balance between technological edge and disciplined judgment.
AI applications extend well beyond trading desks. For example, in healthcare, AI-driven imaging helps identify patient risk factors. In finance, AI models visualize portfolio risk exposures. In marketing, AI-based dashboards track customer engagement trends visually, and in education, adaptive visual learning platforms cater to individual student needs. These cross-industry examples show how visual tools and AI can drive clarity and efficiency in a wide range of fields.
Digital Planning Platforms
The demands of modern trading require adaptable visual planning platforms. Leading digital solutions now offer:
- Interactive mind maps for mapping out complex trading strategies
- Real-time risk visualizations to support live decision-making
- Customizable dashboards for tracking performance metrics
- Timeline and project management tools for setting and reviewing trading goals
Selecting the right tools depends on your methods and trading style. The best platforms reinforce disciplined execution while providing flexibility, adaptability, and depth of analysis.
Just as traders use visual dashboards to monitor trades, project managers in other industries rely on digital planning boards to track workflow and timelines. In retail and e-commerce, real-time inventory heat maps assist in optimizing stock levels, while legal professionals employ contract visualization software to map compliance progress. These examples highlight the universality of visual planning beyond the trading world.
Implementing Visual Planning Routines
Integrating these tools into daily, weekly, and monthly routines is critical for lasting discipline and measurable progress.
Daily Visual Reviews
Consistency is key to growth and composure. Establishing a structured daily review routine cultivates lasting discipline and informed decision-making. Essential steps include:
- Morning market landscape visualizations to set the context for the day
- Pre-market adjustment flowcharts that clarify strategic shifts
- Real-time session execution maps to maintain strategy alignment
- End-of-day performance documentation for reflection and learning
These daily rituals anchor your actions to your overarching objectives. Visual reviews are not just record-keeping exercises; they provide a clear, immediate reference that keeps intuition and emotion in check during volatile sessions.
A robust morning trading routine can anchor your visual review process and set a foundation for consistent, productive trading days.
Stay Sharp. Stay Ahead.
Join our Telegram Channel for exclusive content, real insights,
engage with us and other members and get access to
insider updates, early news and top insights.
Join the Channel
In other sectors, such as healthcare, daily patient dashboards help medical teams track vital statistics and prioritize care. In education, teachers use progress charts to visualize student learning outcomes. These approaches highlight how daily visual routines drive performance and improvement across professions.
Weekly and Monthly Planning Systems
Long-term growth demands a high-level view. Weekly and monthly planning systems build context and reinforce daily discipline. Effective periodic planning includes:
- Weekly updating of strategy maps to reflect market changes
- Monthly visual performance boards summarizing key lessons and patterns
- Quarter-by-quarter goal tracking dashboards for targeted growth
- Annual roadmaps that visually chart major milestones
Stepping back at these intervals encourages traders to identify hidden trends and make timely adjustments. This method reveals strengths, weaknesses, and market shifts that might escape notice in the daily grind.
Similarly, executives in corporate finance rely on monthly and quarterly dashboards to track profitability and pinpoint areas for improvement. Environmental scientists use periodic data visualizations to monitor ecosystem health, while consumer marketers review campaign performance boards monthly to optimize strategies. These examples illustrate how structured visual planning cycles foster improvement in diverse settings.
Measuring Success Through Visual Metrics
Tracking progress visually ensures your effort translates into results. Effective measurement strengthens habits, pinpoints opportunities, and guides adaptation.
Performance Visualization Techniques
Key metrics become most impactful when rendered in intuitive visual formats. Successful approaches include:
- Heat maps illustrating trading performance by time, asset, or strategy
- Equity curve charts with overlays marking major strategic changes
- Position sizing diagrams to track risk exposure at a glance
- Color-coded journals mapping trading psychology states in real time
Visual data delivers instant feedback and makes progress visible. This method enables rapid adjustments and reinforces positive behavioral patterns.
Professionals in non-trading domains also benefit from visual performance monitoring. In project management, Gantt charts map project timelines and resource allocation. Financial analysts use risk/return scatter plots to assess portfolio performance, while teachers track student engagement through color-coded participation matrices. The impact of visual feedback is universal; it transforms abstract metrics into immediate, actionable insights.
Advanced Performance Analytics
Modern platforms provide a new generation of analytic tools that blend AI sophistication with visual clarity:
- AI-powered recognition of behavioral trading patterns, highlighting areas of improvement
- Visual correlation maps to compare multiple strategies or assets
- Risk-adjusted performance graphs to contextualize returns
- Market impact dashboards displaying how different scenarios influenced trading outcomes
When traders combine these advanced analytics with traditional visual documentation, they gain a holistic view of their progress and a firm foundation for adaptive, data-driven strategy refinement.
If you’re seeking to further hone your approach with visual routines and journaling, explore visual journaling for confident trade entries to strengthen your feedback loops and refine your trading edge.
In healthcare, AI-assisted diagnostic dashboards combine patient data visualization with predictive insights. Marketing analytics platforms display campaign effectiveness through integrated heat maps and conversion funnels. Environmental scientists use visual models to map resource allocation and climate impact trends. Each of these examples underscores the value of visual analytics for continuous performance improvement across various professions.
Integration with Trading Psychology
Lasting trading success is rooted in mental discipline. Visual planning serves as a bridge connecting strategy to mindset and routine.
Visual Anchoring Techniques
The brain responds powerfully to visual cues. Practical applications for trading psychology include:
- Pre-trade checklists displayed on visual boards to reduce oversight and doubt
- Color-coded systems for tracking mood and emotional state to build self-awareness
- Reference charts of risk tolerance, reinforcing discipline under stress
- Decision confirmation flowcharts that ensure every action aligns with the larger plan
These techniques serve as psychological checkpoints, preventing emotional lapses and reinforcing structured decision-making even during periods of uncertainty.
Reviewing your trading psychology can help you implement even more resilient visual and mental anchors to overcome challenges in high-stress market environments.
Comparably, in healthcare, visual medication charts help prevent errors, and in aviation, pilots rely on visual checklists for safety compliance. In legal practice, visual compliance charts help lawyers ensure every contract step is fulfilled. Such techniques solidify the power of visual anchors in demanding environments.
Building Mental Models
Developing mental agility is essential for navigating complex markets. Consistent visual planning helps traders construct and refine mental models, including:
- Visual frameworks for recognizing market conditions and filtering noise
- Strategy trees for selecting the right approach in real-time
- Risk management diagrams that reinforce systematic position sizing
- Feedback loops that highlight what’s working and what needs adjustment
With every visual planning session, your mental maps become sharper and more nuanced. Over time, these internalized frameworks support both intuition and rigorous decision-making alike.
For those interested in leveraging pattern frameworks and filters, consider pattern filtering techniques to turn market chaos into actionable insights.
In technology, software engineers visualize architectures to optimize system design. Sports coaches use play diagrams to build athletes’ situational awareness and strategy selection. In education, students employ mind maps for organizing knowledge and improving recall. These examples all point to the cross-disciplinary impact of robust mental modeling through visualization.
Conclusion
The journey to trading mastery demands more than technical skill. It requires the steady application of visual planning, structured reflection, and disciplined self-management. By embracing strategy mapping, AI-enhanced visualization, and meaningful performance tracking, traders sharpen both their technical and psychological edge. This cultivates the resilience and clarity needed to prosper in unpredictable markets.
Each visual tool, whether a detailed chart, insightful flowchart, or adaptive dashboard, serves as a mirror reflecting not just your decisions, but your personal growth as a market participant. As you develop and refine these routines, remember that genuine longevity in trading is built on the habits of disciplined execution, continuous learning, and honest self-assessment.
Looking ahead, mastery will favor those who embrace structured adaptability and remain proactive in adopting new technologies and feedback-driven methods. Whether charting a course through uncertain markets, optimizing risk in other industries, or transforming learning and management with visual planning, your commitment to disciplined practice and clear strategy will distinguish you in any competitive environment. The question is not whether you will use these advancements, but how rigorously you will apply them to achieve authentic, lasting excellence.
Strategy. Discipline. Mastery. | The Way of the Market Warrior

Leave a Reply