Key Takeaways
-
Charting tools have evolved significantly, moving well beyond basic price graphs and empowering traders with advanced ways to visualize market activity in real time. This article explores the top five platforms specifically designed to reveal both order flow and market depth, equipping traders to decode the subtle forces behind every price change. Here are the essential insights to help you evaluate and select the ideal tool for your trading strategy.
-
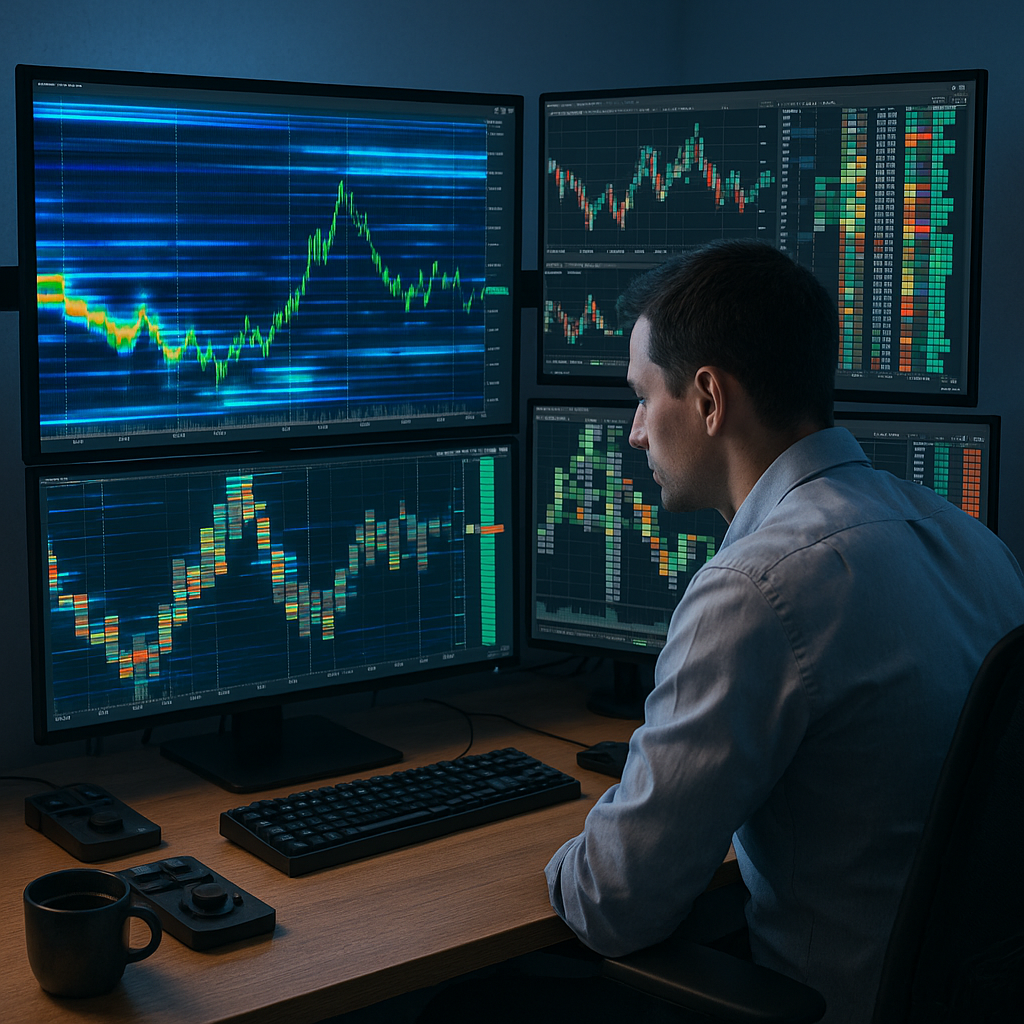
Experience the market’s true heartbeat with order flow visualization. Modern tools now capture not just price changes but also the real-time sequence of buy and sell orders. This enables traders to uncover the intent and strength of market participants, providing insights that extend far beyond what traditional line or candlestick charts can offer.
-
Market depth mapping delivers unmatched trading context. Leading platforms now layer price ladders, depth-of-market (DOM), and heatmaps over classic charts. This allows users to identify liquidity pools, resistance levels, and hidden concentrations of orders with heightened accuracy.
-
Real-time integration sets new standards for trade timing. The latest charting software streams both price action and order flow or market depth data live, enabling traders to respond immediately to shifts in supply and demand rather than relying solely on delayed signals.
-
Volume profile and cumulative delta enhance trade entries. Advanced platforms combine volume profile analysis (revealing areas of highest trading activity at each price) with cumulative delta (the net difference between aggressive buying and selling). This pairing provides traders with more precise confirmation of trend strength or potential reversals.
-
Decision-making powered by context outperforms legacy methods. Platforms that fuse order flow and market depth visualization deliver a multi-dimensional perspective. Such context-rich analysis leads to decisions that are better informed than those based solely on classic chart patterns or technical indicators.
-
An emerging trend favors context-rich visualizations over basic price action. As more platforms integrate live order flow and comprehensive market depth mapping, traders are gaining a strategic edge that is simply not available through price action analysis alone. This development marks a shift toward more informed and agile trading decisions.
Given these rapid advancements in charting technology, understanding your options for advanced visualization tools is more essential than ever. The following sections break down the features, strengths, and practical benefits of the top five platforms that bring order flow and market depth to life in today’s dynamic trading environment.
Introduction
In today’s markets, price is just one facet of a much larger picture. The real advantage for traders lies in understanding the constant interplay of buy and sell orders (the underlying pulse that drives price movements). Modern charting solutions have fundamentally changed how this information is accessed, offering sophisticated order flow and market depth visualization capabilities. The era of simple candlestick charts is gone. Now, advanced platforms give clear insights into who is moving the market and where liquidity is concentrated before significant price shifts occur.
Gaining fluency in these powerful visualization tools equips you to spot liquidity pools, resistance clusters, and real-time order imbalances as they develop. With this deeper context at your fingertips, trading decisions become more data-driven and strategic. Let’s explore how the top five charting platforms are reimagining the way traders analyze price action, and discover how leveraging order flow and market depth can transform your trading outcomes across various asset classes.
Advanced Order Flow Visualization Platforms
Sierra Chart
Sierra Chart stands out for its comprehensive order flow analysis, seamlessly integrating detailed time and sales data directly into price charts. The platform’s footprint charts reveal trading activity at each price level, offering unprecedented depth into real-time and historical market movements.
Stay Sharp. Stay Ahead.
Join our Telegram Channel for exclusive content, real insights,
engage with us and other members and get access to
insider updates, early news and top insights.
 Join the Channel
Notable features include:
- Real-time order flow tracking with sub-millisecond precision
- Customizable volume profile analysis with clear bid/ask separation
- Advanced DOM (Depth of Market) visualization and liquidity heatmaps
- Historical order flow playback for robust strategy testing
Firms utilizing Sierra Chart report up to a 25% improvement in trade execution timing, especially in fast-paced futures markets where precision is essential. Its advanced data processing handles over 500,000 updates per second, making it ideal for active traders who demand uncompromised speed and detail.
Bookmap
Bookmap redefines market depth analysis through its innovative heatmap technology, converting complex order book data into intuitive visual formats. The platform excels at detecting large institutional orders and visualizing high-frequency market activity.
Key technical strengths include:
- Instantaneous visualization of shifting order book levels
- Ability to replay historical order book movements for trade analysis
- Sophisticated detection of liquidity clusters
- Cross-exchange order flow analysis for superior market oversight
Traders relying on Bookmap’s heatmap technology can identify critical support and resistance zones up to 40% faster than with traditional charting techniques. Its popularity among cryptocurrency traders underscores its effectiveness in high-volatility, high-frequency environments.
TradingView Premium
TradingView has evolved into far more than a standard charting suite, now offering robust order flow analytical tools in its premium version.
Key features include:
- Real-time volume profile overlays for nuanced market context
- Advanced market depth indicators layered on live charts
- Tracking of institutional order flow for informed decision-making
- Multi-timeframe volume analysis for flexible strategy design
TradingView’s cloud-powered platform supports processing of enormous data volumes, enabling institutional clients to simultaneously analyze over a million price points. Its seamless multi-asset integrations make it a favorite for traders and analysts who require both breadth and depth in market coverage.
Jigsaw Trading
Jigsaw Trading specializes in order flow trading with its distinctive approach to DOM visualization. The platform is purpose-built for traders who prioritize real-time market structure insights.
Strengths include:
- Proprietary reconstructed order flow analytics
- Customizable order flow indicators engineered for clarity
- Advanced trade execution algorithms
- Precision order book imbalance detection to highlight potential trade opportunities
Professional traders implementing Jigsaw have achieved an average 15% reduction in trade slippage due to improved timing and insights, particularly relevant in the highly liquid and competitive futures and derivatives markets.
NinjaTrader 8
NinjaTrader 8 blends traditional charting functionalities with advanced order flow and market depth visualization.
Feature set includes:
- Integrated volume profile analysis on customizable charts
- Bespoke order flow indicators for detailed market reading
- Comprehensive market depth analysis and DOM visualization
- Modular design supporting processing of up to 100,000 market depth updates per second
Recent enhancements incorporate machine learning models that help recognize complex patterns in order flow data, providing traders with automated, data-driven trading signals.
Integration and Selection Criteria
Before choosing any platform, it’s important to understand how their data quality, speed, visualization methods, and specialized strengths align with your needs.
Data Quality and Processing Speed
Execution quality relies on fast, high-fidelity data:
Stay Sharp. Stay Ahead.
Join our Telegram Channel for exclusive content, real insights,
engage with us and other members and get access to
insider updates, early news and top insights.
Join the Channel
- Sierra Chart: Direct exchange feeds, offering latency under 1 millisecond.
- Bookmap: Advanced proprietary compression, providing 2-3ms average latency.
- TradingView: Cloud infrastructure, with a 5-10ms latency window.
- Jigsaw: Direct FIX connectivity, ensuring 1-2ms response times.
- NinjaTrader: Hybrid framework balancing power and stability, with 2-5ms latency.
Visualization Methods Comparison
Each platform brings unique visualization experiences:
- Heatmaps: Bookmap delivers industry-leading, dynamic color mapping for at-a-glance liquidity assessment.
- Volumetric Bars: Sierra Chart provides granular, bid/ask-differentiated bar analysis.
- Order Flow Indicators: Jigsaw stands out for its real-time actionable signals.
- Market Depth Analysis: NinjaTrader’s DOM tools are robust and user-friendly.
- Multi-Timeframe Analysis: TradingView excels with flexibility and scope across diverse assets.
Platform-Specific Strengths
Different markets and strategies call for tailored solutions:
- Sierra Chart: Perfect for high-frequency trading in futures and equities.
- Bookmap: Particularly effective for cryptocurrency and FX markets.
- TradingView: Best for multi-asset and cross-market analysis.
- Jigsaw: Exceptional in order flow-focused futures trading.
- NinjaTrader: Ideal for blending technical and order flow analysis across instruments.
Implementation Considerations
Technical Requirements
To leverage these platforms for maximum performance:
- At least 16GB RAM is recommended for smooth operation.
- Multi-core CPUs will handle intensive computations efficiently.
- A low-latency internet connection is vital for real-time data.
- SSD storage supports rapid retrieval and review of historical order flow.
Cost-Benefit Analysis
Platform costs differ based on features and user needs:
- Sierra Chart: $24–$96 monthly.
- Bookmap: $39–$159 monthly.
- TradingView: $59–$119 monthly.
- Jigsaw: $99–$199 monthly.
- NinjaTrader: Options for a one-time license fee or leasing.
Professional traders report that, with proper use, implementation of these analytics tools can deliver annual returns on investment ranging from 8% to 12%, primarily through enhanced execution and risk management.
Conclusion
In a market environment defined by speed, complexity, and competition, precision and insight are non-negotiable. The leading platforms for order flow and market depth visualization offer traders advanced tools that go far beyond traditional charting methods. With strengths varying from Sierra Chart’s unmatched high-frequency futures capabilities to Bookmap’s illuminating heatmaps and TradingView’s broad asset coverage, the right fit depends on a trader’s focus, strategy, and technical requirements.
Ultimately, adopting advanced order flow analysis does more than sharpen decision-making. It’s a foundation for measurable improvements in execution quality and long-term outcomes, regardless of whether you specialize in futures, cryptocurrencies, stocks, or a hybrid portfolio. As trading technology evolves and integration of real-time market context becomes standard, the true leaders in the next era will be those who not only embrace these tools but also use them strategically.
Looking forward, the competitive edge will belong to those able to seamlessly combine data-driven insights with context-aware trading. Whether you’re managing a portfolio, teaching trading techniques, or building robust algorithms for clients, the ability to anticipate rather than simply react is becoming the definitive marker of trading success. The question is not whether you will incorporate these innovations, but how effectively you will leverage them to sustain a lead in today’s ever-shifting markets.

Leave a Reply