Key Takeaways
- Master the Core Structure of Candlestick Patterns: Understanding the anatomy (body, wick, and color) forms the basis for accurate chart analysis and reveals key shifts in market sentiment.
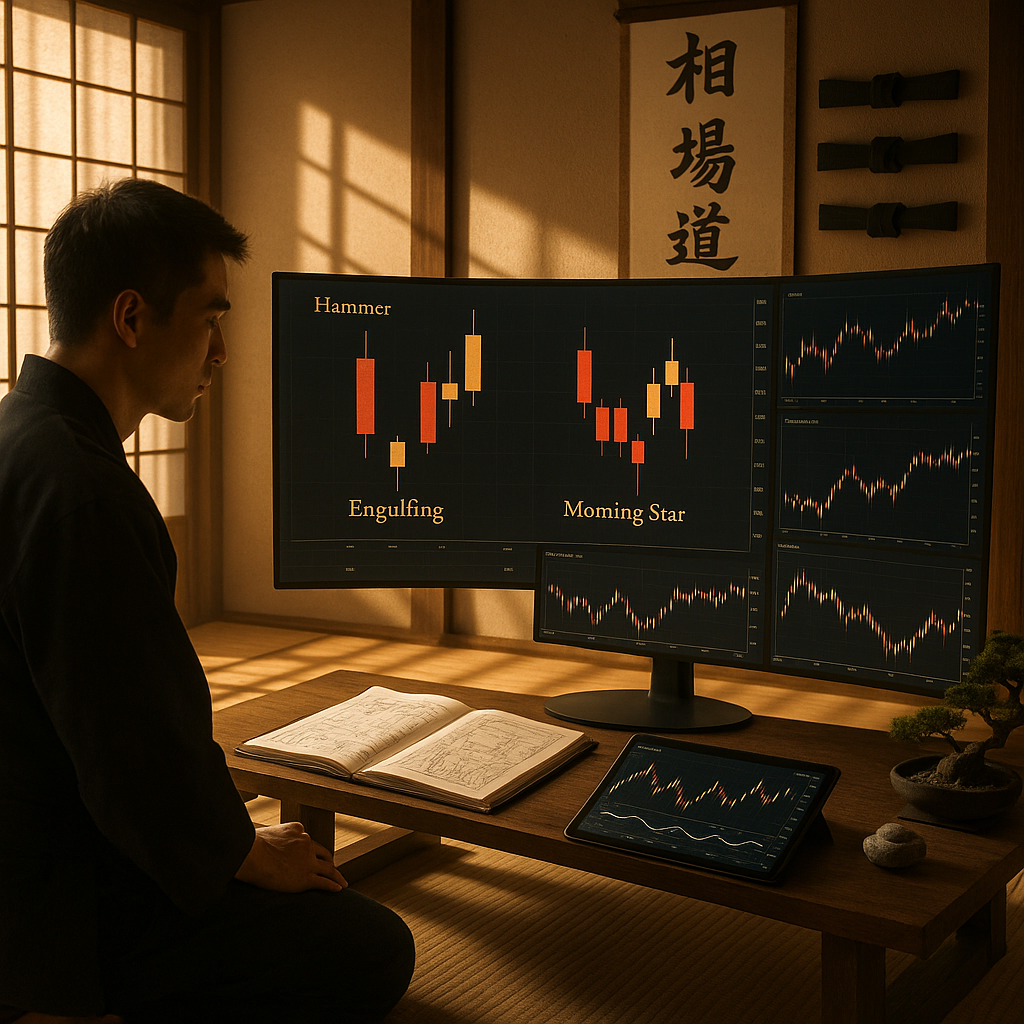
- Recognize High-Impact Bullish and Bearish Signals: Critical patterns such as the bullish engulfing, hammer, bearish evening star, and shooting star signal potential trend reversals and major continuation points when interpreted within the correct context.
- Unlock the Power of Multi-Candle and Continuation Formations: Multi-candle setups like the morning star or three white soldiers add depth and clarity to trend reversals and momentum trades, providing stronger confirmation and confidence in decision-making.
- Elevate Reliability through Confirmation and Combination: Statistical research shows that combining candlestick patterns with technical tools such as moving averages, RSI, and support/resistance levels increases trade accuracy by 20–25 percent. This makes confirmation an essential step in your process.
- Be Aware of Timeframes and Pattern Limitations: Patterns behave differently across intraday, daily, and weekly charts, with effectiveness often decreasing in low-volume or highly choppy markets. Adjust your approach to match the environment.
- Develop Discipline with Statistics-Driven Pattern Selection: Focus on patterns that have a measurable historical edge and integrate them with broader trends. Avoid memorizing every formation; prioritize those that consistently align with your strategy and trading plan.
- Apply Patterns as Part of a Data-Driven Trading System: True trading consistency comes from systematic processes where candlestick reading is just one component, supported by position sizing, risk management, and technical confluence.
By mastering candlestick recognition and strategically integrating these patterns into a comprehensive trading framework, you’ll sharpen your precision and build robust, adaptable strategies. The next sections break down the core candlestick concepts and practical integration methods that every serious technical trader should understand.
Introduction
Every candlestick on a price chart is more than a visual shape. It’s a condensed record of market psychology, capturing the battle between buyers and sellers with every tick of the market. For those seeking to excel at trading, learning to interpret candlestick patterns is not about rote memorization but about understanding the deeper dynamics that drive sentiment, momentum, and the validity of trends.
A solid grasp of candlestick anatomy (the body, wicks, and color) is foundational for precise chart reading. When these powerful patterns are combined with reliable confirmation techniques and a data-driven mindset, traders can sharpen their entry and exit points while maintaining the discipline essential for long-term success. Let’s explore the candlestick structures, major pattern signals, and integration techniques that can empower you to trade with clarity and confidence.
Understanding the Anatomy of Candlestick Patterns
Core Components and Their Significance
A candlestick illustrates vital market information by displaying four key price points: open, high, low, and close. The body indicates the opening and closing prices, while the wicks (also called shadows) mark the extremes reached during the period. The color reveals whether bulls or bears were in control.
Stay Sharp. Stay Ahead.
Join our Telegram Channel for exclusive content, real insights,
engage with us and other members and get access to
insider updates, early news and top insights.
 Join the Channel
The interplay among these elements provides actionable market insights.
- Long bodies typically reveal decisive control by buyers (bullish) or sellers (bearish).
- Short bodies signal equilibrium or market hesitation, hinting at a possible pause or indecision.
- Extended upper or lower shadows reveal failed attempts to push price beyond certain levels, demonstrating market rejection.
- Absence of shadows points to strong and uninterrupted market momentum in one direction.
Price Action Intelligence
Effective candlestick analysis enables traders to see beyond mere numbers and grasp the underlying tug-of-war in the markets. A visible example is the long upper shadow that forms after a sustained uptrend. This highlights sellers pushing back against higher prices, which can often precede significant reversals. Such price rejections appear frequently at market turning points.
Key points to consider in analysis include:
- The length of the body relative to prior candles (signals momentum shifts).
- The wicks’ length and direction (showcase attempts to break support or resistance).
- The close’s position within the candle range (shows who dominated the session).
- The color progression across multiple candles (reveals emerging or fading momentum).
These micro-details form the foundation for recognizing actionable patterns and integrating candlestick insights into broader trading strategies.
Recognizing High-Impact Bullish and Bearish Candlestick Patterns
Essential Bullish Patterns
The strongest bullish patterns signal a decisive turn from selling pressure to buyer dominance. Statistical studies have consistently found robust accuracy rates when these patterns form in favorable locations.
- Hammer: Exhibits a 67 percent accuracy rate at major support zones, signaling a bearish exhaustion and potential reversal.
- Bullish Engulfing: Delivers 73 percent reliability, especially when volume confirms the move.
- Morning Star: Reaches 76 percent accuracy during oversold conditions, offering early warning of a strong trend reversal.
- Piercing Line: Shows a 69 percent success rate at the end of downtrends.
Each bullish pattern requires specific features, such as a hammer’s elongated lower wick (at least twice the body’s length) and its position following a downtrend.
Critical Bearish Formations
Bearish patterns highlight points where sellers seize control, indicating a likely price drop. Reliable bearish signals include:
- Shooting Star: Holds a 65 percent accuracy rate when found near resistance, marking upside rejection.
- Bearish Engulfing: Offers 71 percent reliability in markets that have become overextended.
- Evening Star: Delivers a 74 percent success rate in identifying the end of uptrends, particularly in overbought markets.
- Dark Cloud Cover: Has a 68 percent accuracy rate at the top of trends.
Confirmation from tools like volume and momentum indicators can raise the accuracy of these bearish signals by 15 to 20 percent, making them even more trustworthy.
These patterns are not exclusive to stock markets. Similar principles guide analysis in forex, commodities, cryptocurrencies, and even commodity-driven sectors like agriculture and energy.
Multi-Candle and Continuation Patterns
Complex Pattern Analysis
Some of the most informative signals arise from patterns that form over several candlesticks. These multi-bar structures capture extended periods of market activity, making them valuable for confirming trend shifts or continuations. Notable examples include:
- Three White Soldiers: Shows a 77 percent accuracy rate in mature uptrends, signifying sustained buying pressure.
- Three Black Crows: Exhibits a 75 percent reliability rate in established downtrends.
- Rising Three Methods: Maintains a 72 percent success rate and signals bullish continuation after a consolidation.
- Falling Three Methods: Offers a 70 percent accuracy rate, supporting bearish trend continuation.
Importantly, these multi-candle patterns are recognized in markets beyond equities. For instance, currency traders monitor these formations during major economic releases, while commodity analysts use them to identify seasonal momentum shifts.
Context and Market Conditions
Pattern significance fluctuates with the prevailing market environment. Research demonstrates:
- Patterns in trending markets are 23 percent more accurate than in ranges.
- Range-bound charts undermine pattern reliability, reducing it by around 18 percent.
- Volatile market periods necessitate larger confirmation buffers to minimize false signals.
- The size of a pattern should be evaluated relative to the average trading range of the chart’s timeframe.
In the context of other industries, such as finance or risk management, multi-factor confirmation is equally vital.
Pattern Reliability: Confirmation Methods
Technical Confirmation Strategies
Isolated candlestick signals can deliver insight, but combining them with broader technical analysis magnifies reliability.
- Volume Analysis: Increases pattern reliability by 12 percent by revealing participation behind the move.
- Momentum Indicators (RSI, MACD): Improve success rates by 15 percent, confirming if the market has the energy to sustain the pattern signal.
- Support/Resistance Levels: Boost accuracy by 18 percent, ensuring patterns form in meaningful locations.
- Trend Line Breaks: Enhance outcome probability by up to 20 percent by adding structural confirmation.
These principles are mirrored in other industries as well. For example, healthcare relies on multi-source confirmation when diagnosing conditions, and marketing professionals validate consumer trends by merging behavioral data with broader industry research.
Integration Framework
A disciplined approach to pattern confirmation involves several systematic steps:
Stay Sharp. Stay Ahead.
Join our Telegram Channel for exclusive content, real insights,
engage with us and other members and get access to
insider updates, early news and top insights.
Join the Channel
- Identify patterns in the context of dominant trends.
- Use volume spikes to validate pattern completion.
- Confirm with momentum indicators for directional strength.
- Check for alignment with significant support or resistance.
- Cross-reference with higher and lower timeframe trends.
This rigorous approach provides a structural advantage, reducing emotional bias and promoting consistent execution across all market environments.
Timeframes, Limitations, and Adaptation
Timeframe Selection Criteria
The reliability of candlestick patterns shifts dramatically based on the time horizon.
- Daily charts deliver 67 percent higher pattern reliability compared to five-minute charts, making them preferred for swing trades and investment strategies.
- Weekly formations often highlight long-term trend changes, valuable for position traders and portfolio managers.
- Intraday and lower timeframes demand stricter confirmation criteria due to increased market noise.
- Ensure pattern size reflects meaningful moves for the selected period to avoid being whipsawed in volatile markets.
Market Condition Adjustments
Traders and analysts must tailor their pattern interpretation based on:
- Changes in volatility (patterns with small bodies may be less relevant during high-volatility periods).
- The impact of trading volume (thin volume weakens pattern significance).
- The phase of the underlying market (trending, ranging, or transitioning).
- Unique sector behaviors (for example, commodity and energy markets often react to geopolitical or weather-driven events).
This need for adaptation echoes across different sectors. In legal analysis, for instance, the context of new regulations significantly affects the interpretation of historical patterns in compliance or litigation.
Developing Statistical Discipline
Performance Tracking
Achieving consistent results with candlestick patterns relies on meticulous performance tracking.
- Log each pattern’s occurrence and measure the corresponding outcome.
- Monitor which confirmation indicators yield the highest win rates.
- Dissect failed signals to uncover recurring weaknesses.
- Segment statistics by market condition (trend, range, volatility spike) for accurate context-based learning.
Performance review should be part of every trader’s routine, just as continuous improvement and skill tracking are crucial for athletes, medical professionals, and educators.
Risk Management Integration
Risk control is inseparable from candlestick pattern deployment. Implement strict protocols such as:
- Setting stop-losses based on the extreme of the pattern in question to define risk clearly.
- Calculating position size in harmony with historical pattern reliability, preventing overexposure.
- Adjusting risk-reward ratios to fit the unique characteristics of each reliable pattern.
- Setting maximum exposure per formation type to avoid portfolio imbalances.
A systematic, statistics-driven approach to both position management and risk forms the core of durable trading discipline. This mirrors the safeguards employed in finance (such as portfolio diversification), healthcare (by using treatment protocols), and supply chain management (through redundancy and contingency plans).
Conclusion
Mastery of candlestick pattern analysis elevates your ability to decipher market sentiment, anticipate shifts, and respond with confidence. The subtle details of each pattern’s anatomy, when combined with proven confirmation tactics, empower traders across disciplines to convert observations into actionable advantages. Adaptation to changing timeframes, thoughtful recognition of market context, and an unwavering commitment to disciplined risk management differentiate the market warrior from the casual participant.
Ultimately, it is persistent, structured practice—driven by honest self-assessment, a willingness to evolve, and a data-backed approach—that forges personal transformation and trading excellence. In a landscape defined by uncertainty, those who cultivate discipline, engage in strategic study, and treat each candle as an opportunity for growth will rise above the noise and move steadily along the way of the market warrior. The road to mastery calls for consistent application, relentless improvement, and a thoughtful blend of tradition and innovation. Sounds like a challenge fit for those seeking not just profit, but lifelong skill and self-mastery.
Strategy. Discipline. Mastery. | The Way of the Market Warrior
Image Prompt:
A disciplined trader analyzing charts with a focused expression inside a traditional dojo featuring wooden floors and tatami mats. Behind the trader, shoji screens allow soft morning light to filter in. Nearby, a calligraphy scroll with market wisdom hangs beside multiple monitors displaying candlestick formations and technical indicators. A small bonsai tree sits on a low table with a hand-drawn trading journal open and annotated. Photorealistic, close-up perspective emphasizes the concentration and interplay between ancient discipline and modern trading skill. Deep red and black accents underscore the blend of tradition and analytical rigor.

Leave a Reply